Peas in a Pod?
Let’s look at a familiar product and see how successful the maker has been at maintaining precision in manufacturing. This activity can be a model for the challenges of manufacturing a product that has to be just about perfect—like a drug.
Teacher Tips!
Many activities have a teacher view and a student view, and teachers can switch between those views by clicking the blue button in the upper-right. Students will not see this option - only teacher accounts see both views. The teacher view will start with overview text, if available, to frame the activity and get you started. This view will also have teacher tips and suggested answers to student questions spread throughout the activity. The teacher text interleaved with student-facing text will be in italics and should appear as a different color on your screen. Teacher tips are designed to help you deliver a learning experience that is best suited for your classroom.
Printing Reminder
Whichever view you see on your screen is what will print. You can print this activity without teacher tips by selecting the student view, or print with teacher tips by switching to teacher view. Simply use the standard print function available for your web browser. No extra steps are required.
Title of Activity: Peas in a Pod
Brief Description: In this activity, students look at efforts to achieve precision in manufacturing. They use candies as a model for the manufacturing of products like pharmaceuticals, and they review statistical tools to describe variance.
Target Grade Level: Grades 8-12
Discipline or Course: Physical Science
Estimated Time Required: One 45-minute session
Individual / Partner / Group Work: Teams of 3-4
Key Vocabulary:
- precision
- mean
- variance
Teacher Prep:
If the candies come in large packages, break them down before the activity.
Differentiation:
Support may be needed to establish the categories in a histogram and to use the caliper.
Taking It Further:
Variation can be determined in almost any product; this makes the procedure ideal for home individualization.
Suggestions for Remote Learning:
There are many online programs which enable students to combine their own data to create a larger database. This improves the activity. At-home investigators can make an effort to contact others to increase the database.
Background Knowledge and Extensions:
Precision involves both reliability (same result every time) and reproducibility (expectation that the result will be the same at another site.) It is distinct from accuracy. Here’s an example; a ruler might be made inaccurately. It would measure the same every time, but always measure inaccurately.
In manufacturing, using the same tools and the same procedures are essential to precision. In this activity, students will evaluate whether some manufacturers succeed in precision.
STUDENT CONTENT BELOW
When things seem exactly the same, we often say they are “like peas in a pod.” To a casual observer, all peas, ants, and grains of sand might seem alike. But how alike are they? The degree to which a product can be reproduced to the same standards every time involves precision.
For some things, being “more or less the same” works fine. A pile of cookies will taste as good if their diameter varies by 5 percent. But if your daily dose of an important medicine varied that much you might be very ill. We rely on measurement to help us identify and create precise products.
Accuracy refers to the closeness of the measurements to a specific value, while precision refers to the closeness of the measurements to each other as they are repeated. It also describes the confidence that we have that we can reproduce the results every time. The precision of any measurement process is limited by tools and standards of measurement. What appears to be a precise measurement for one purpose may be inadequate when the purpose is different.
This activity explores the precision used in manufacturing. In industry, that’s called “process control.” We discuss significant figures (those that carry meaning) to define how confident we are of the precision of our measurements. Some calculations can result in answers with many figures.
Materials:
- One small package of Skittles per group Any type of candy or small, hard, uniform object will serve.
- One small package of regular or peanut M&Ms per group Any type of candy or small, hard, uniform object that is similar to, but distinct from, the first type of object will serve.
- Ruler with mm gradation
- Vernier caliper
- Electronic balance measuring in grams
- White copy paper
- Graph paper or graphing software
Safety Notes:
Never eat in the laboratory.
Procedure I: Manufacturing Precision
- Begin by laying 25 of each candy on a sheet of white copy paper. List all of the similarities and differences that you can observe with the eye. Students may identify chips and variations in dye at this point. Without a sensitive measuring instrument, it is unlikely they could spot size differences.
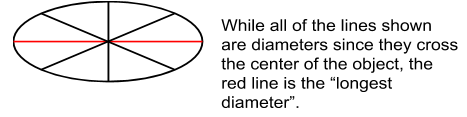
- Using a ruler that measures in mm, measure and record the longest diameter of each candy.
- Is there a difference between candies that can be measured by a millimeter ruler?
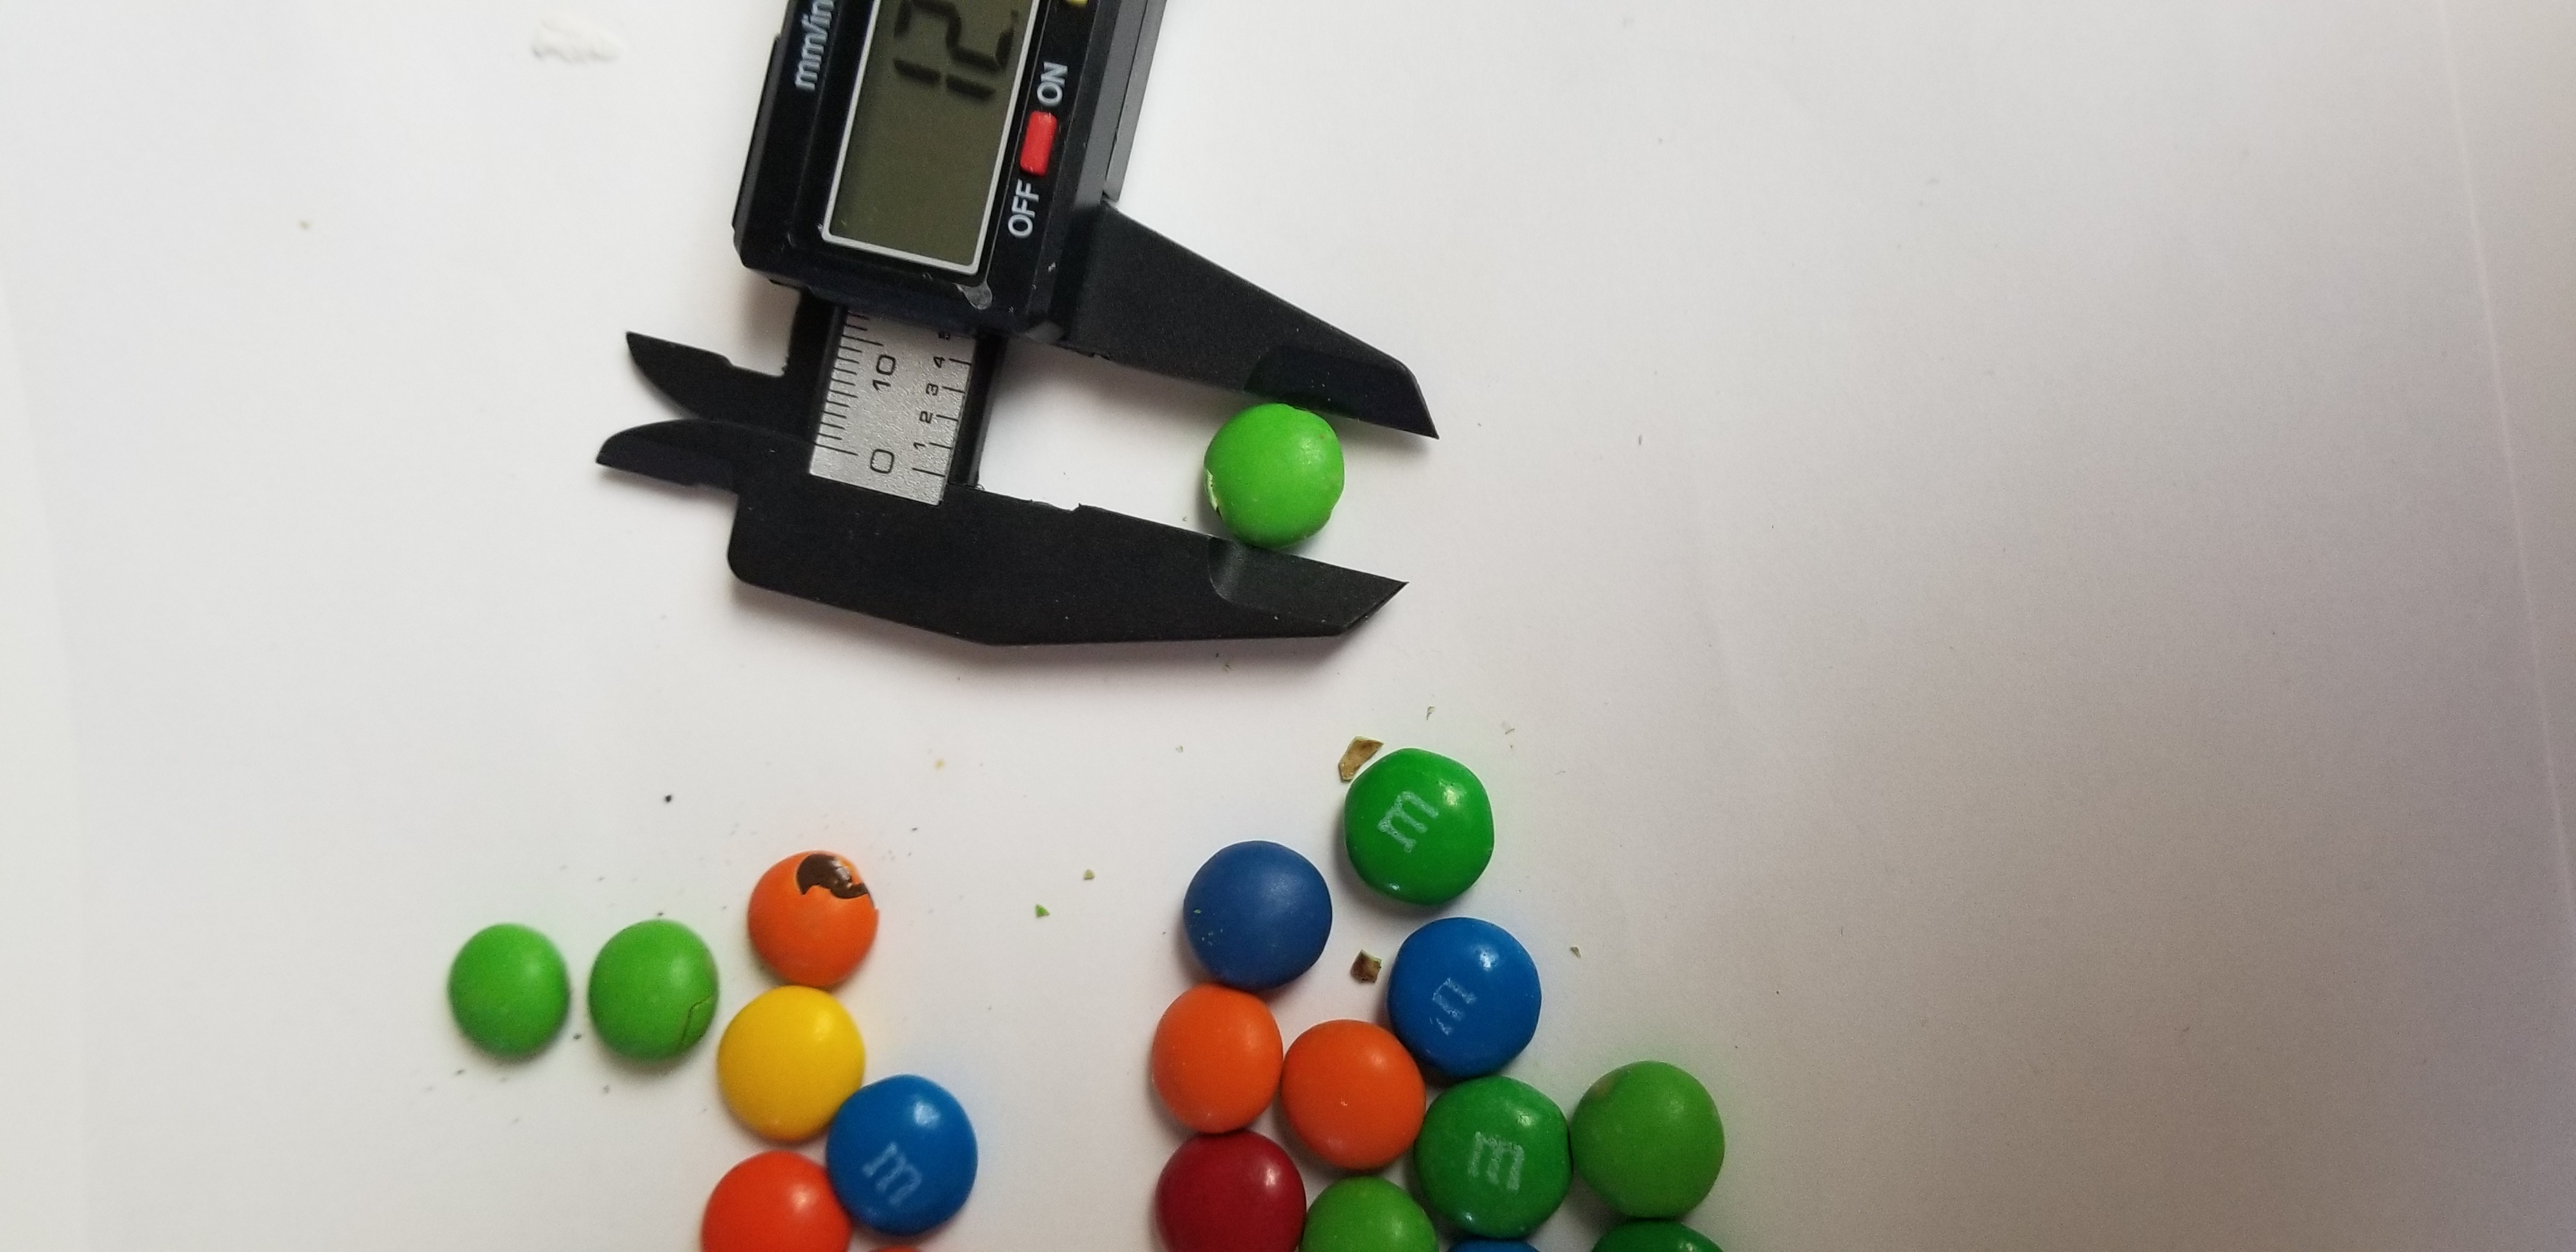
- Repeat the measurements using a Vernier caliper. Can you now measure a difference? It is unlikely that a ruler would get data as reliable as a caliper; that’s part of the point of the lesson.
- If you were able to measure differences, merge data for the entire class and create a frequency histogram that categorizes the candies into groups based on their longest diameter. Remind students that different kinds of graphs convey different purposes. In this activity, they should first think of the limits of their measuring tool. Then they should create categories within those limits. For example, thr caliper may measure to tenths of a millimeter. That determines the x axis. Review how to establish the x axis categories of the histogram. Sort the candies into piles by size range. The graph is a frequency histogram with the numbers of candies in each category on the Y axis.
- Using the data from the caliper, calculate the mean, median, and mode from the diameter data. Merge all class data to create a frequency histogram. If students have the mathematics background, calculating the variance here is quite valuable.
Analysis I:
- What is the smallest measurement that can be measured by a millimeter ruler? One half millimeter.
- Which candy product had the greatest internal consistency (i.e. was manufactured with greatest precision)?
- What limits the precision of the measurement? The tools and the procedures.
Procedure II:
Return to the candies. Measure each candy’s mass on an electronic balance in grams and record as before.
Is there a difference among the candies that can be measured by your balance? If you were able to measure differences, merge data for the entire class and create a frequency histogram that categorizes the candies into groups based on their mass in grams. If your balance cannot distinguish between individual candies, you can also compare random samples of 10 candies.
Analysis II:
- What is the smallest measurement that can reliably be measured by the balance that you used? It will vary by balance.
- What instrument or procedure might be used to answer the question with more precision? Another balance
- With candy, a difference of half a gram is probably not noticeable by the snacker. But what if the product was a pharmaceutical where a very small dose produced significant differences in the patient? What procedures would a pharmaceutical manufacturer use to ensure quality control? Create a list of possible options for future drug manufacturing.
Conclusion:
What did you learn?
What else would you like to know?